Problem
US wildfire history spans decades of records, which makes it hard to get a quick, intuitive read on how patterns have shifted over time without a proper visualisation layer.
Approach
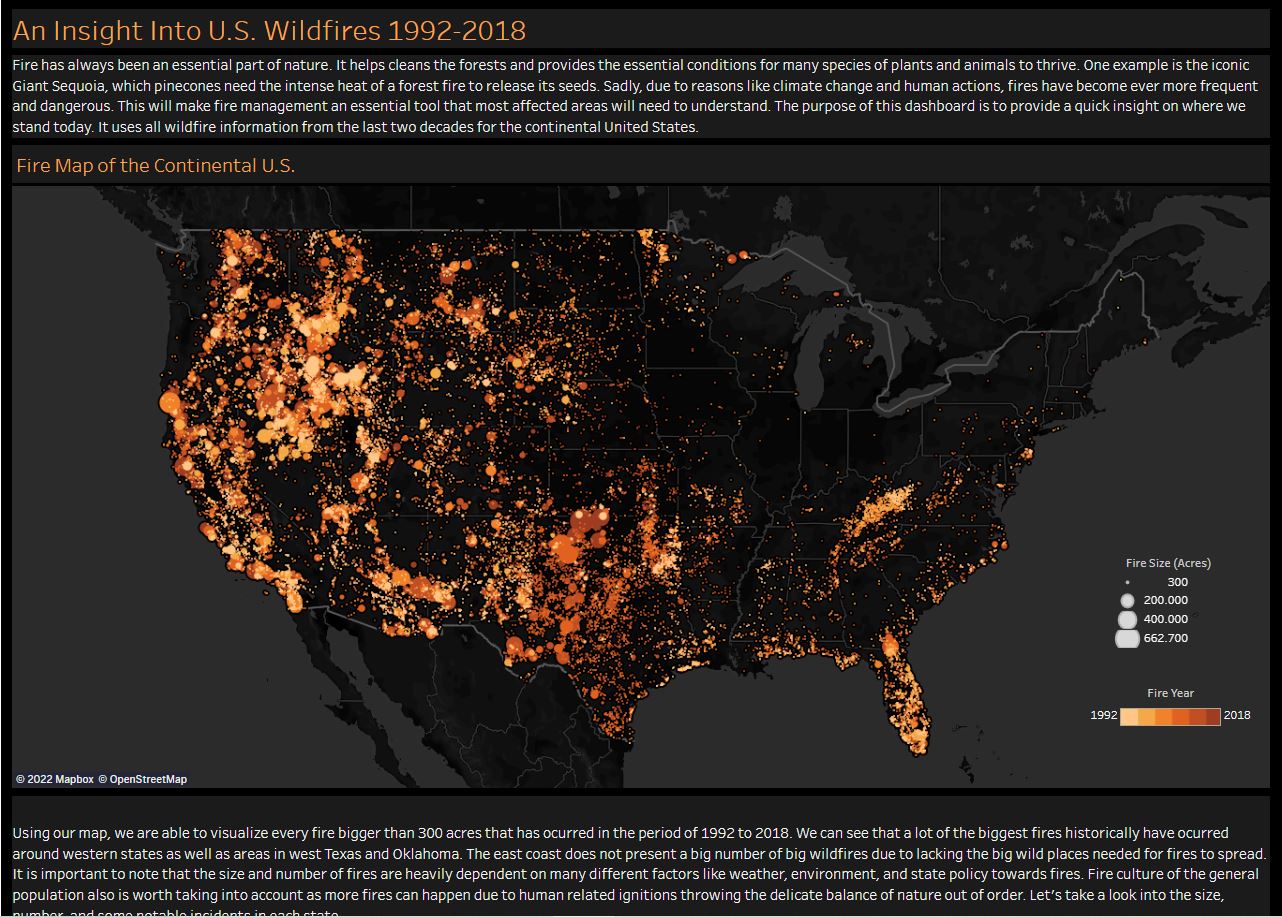
Queried and cleaned a SQLite database of Forest Service wildfire records in R, then built an interactive Tableau dashboard covering the continental United States from 1992 to 2018.
Result
A public, interactive dashboard anyone can explore to see wildfire patterns across the continental U.S. over nearly three decades.