Problem
Prospective renters and homebuyers in Los Angeles have no quick way to compare neighbourhood safety across multiple crime categories in one place. Most crime data sits in raw reports rather than anything visual.
Approach
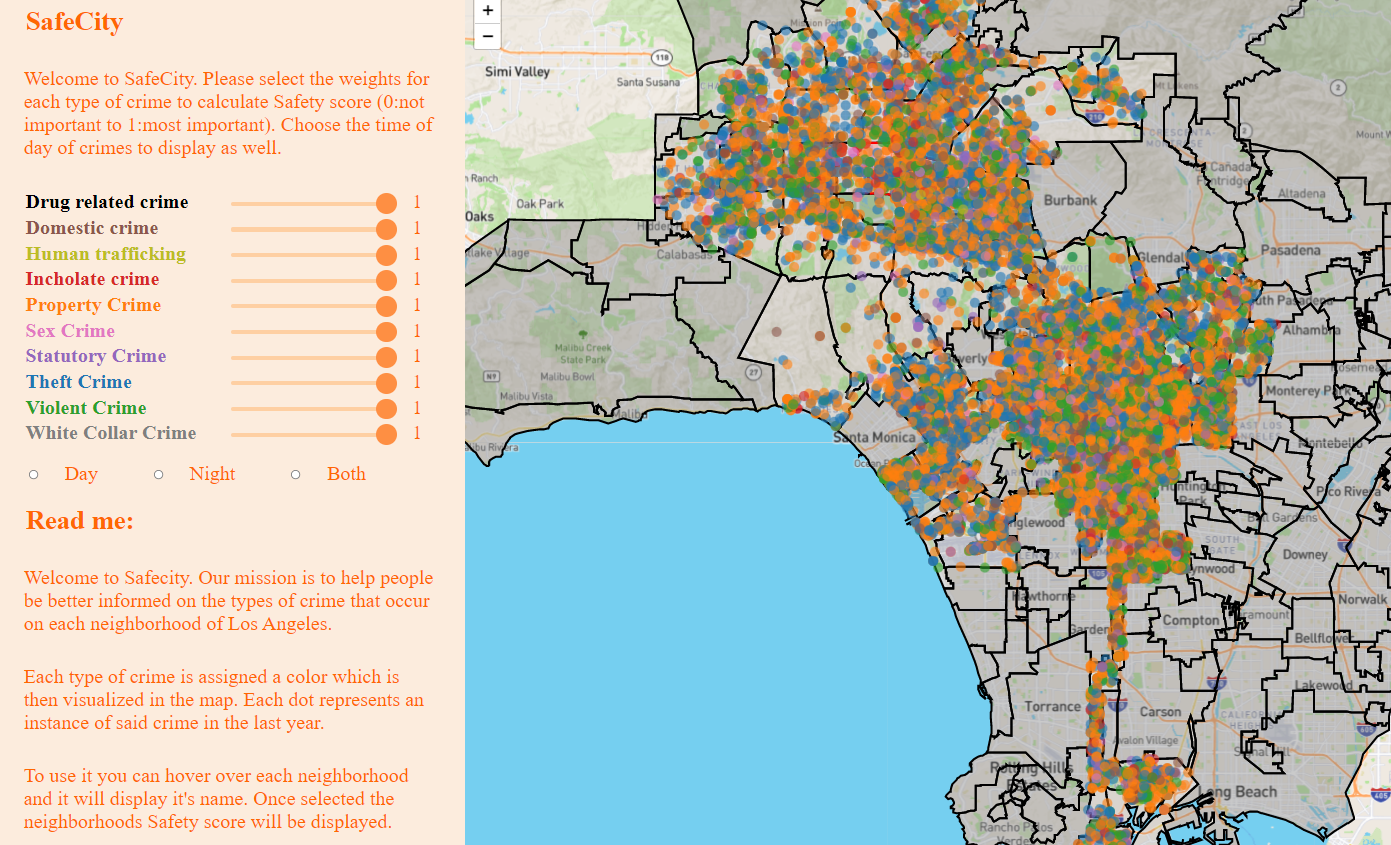
Built, as a team, an interactive visualization combining 10 crime categories with a Google Maps-based interface using D3.js, letting users rank and explore neighborhoods visually rather than digging through spreadsheets.
Result
A working interactive tool, documented in a team poster and full paper, that turns raw crime data into a quick visual safety comparison across neighborhoods.